Want to reach more people on social media? Here’s what to consider!
Title: Static vs. dynamic methods of delivery for science communication: A critical analysis of user engagement with science on social media
Authors: Sarah Habibi and Lidya Salim
First Author’s Institution: Ontario Tech University
Journal: PLOS One (open access)
| TL;DR: Dynamic content (i.e. videos) outperforms static content (i.e. photos) on social media, but the style of dynamic content to post (e.g. longer lecture vs. shorter lecture vs. hands-on experiment videos) and the platform to post them on depends on your individual goals. Why I chose this paper: I’m a social media specialist at a major US observatory, and I’m always looking for evidence-based ways to improve post performance and reach more people! Thanks to this paper, I know to focus efforts on video content, and that the style of video should depend on the goal for the content. |
Think about the last time you were scrolling through social media…what kinds of posts made you pause, like, or comment? Were they videos or photos? Did it matter which platform you were on?
There’s a LOT of research behind what gets people to stop in the middle of mindless scrolling. After all, that’s the entire business model of every social media platform. But what if your motive wasn’t just to keep people on the app, or to generate clicks or ad revenue? What if your motive was to get people to engage more with your content, perhaps learning something in the process?
That’s exactly what today’s authors set out to measure — what gets people to stop scrolling and engage with content on social media, specifically in the context of science education on Instagram and TikTok.
The social media landscape
Social media is everywhere these days, and many science communicators are looking for effective ways of getting science into more social media feeds — and getting people (especially non-scientists) to engage with that content or stick around for more.
In today’s study, Habibi and Salim wanted to answer three distinct questions:
- Do users on social media engage more with educational science content when presented in a dynamic way, and with longer or shorter videos?
- Are users more likely to engage with and share static or dynamic content?
- Which social media platform reaches the most people per post?
To answer these questions, Habibi and Salim posted a variety of science content on Instagram, an app that allows for static photo posts in addition to videos of varying lengths, and TikTok, an app for sharing videos of differing lengths. For each post, they then collected the number of likes, shares, views, and comments as measured by each platform’s analytics reporting.
The authors created 20 separate posts over the course of a year on Instagram that consisted of both static photos and dynamic science experiment videos. They additionally took part in the TikTok Creator Fund by posting 40 videos over the course of six weeks that fell into three separate categories: 40-60 second lecture-style videos, 15 second quick facts videos, and 40-60 second experimentation videos (in which the creator conducts a hands-on science experiment). For all posts on both platforms, the authors collected analytics two weeks after each post went live. However, different posts generally are not seen by the same number of users, so the authors accounted for this by expressing the analytics as a percentage of the number of people that the post reached.
The Results
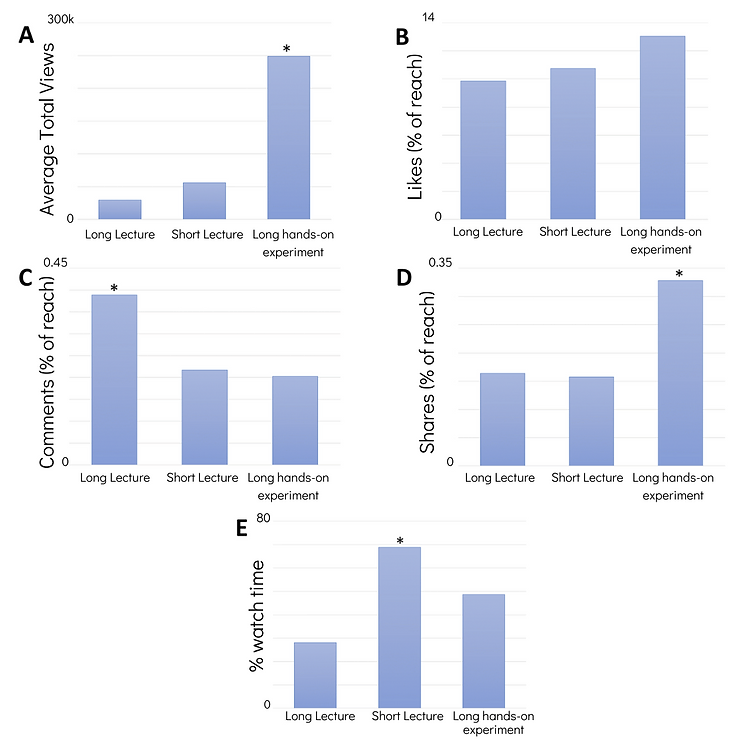
To assess whether users engage more with educational science content when presented in dynamic ways, the authors considered their TikTok data. They were interested in the particular style of video that performed the best — long lecture-style, short lecture-style, or long experimental-style — as measured by a variety of metrics. Figure 1 shows that experimental videos receive the most views, likes, and shares, while long lecture videos receive the most comments and short lecture videos receive the most watch time (relatively speaking).
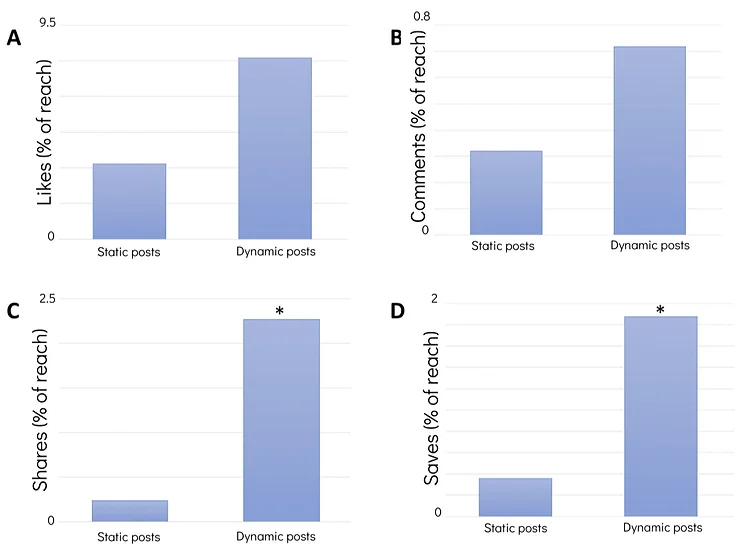
Because Instagram was the only platform considered in this study that allowed for both static content (i.e. photos) and dynamic content (i.e. videos), the authors addressed the question of which types of content users are most likely to engage with and share using their Instagram data. Figure 1 shows that dynamic content performs better as measured by the four metrics considered: likes, comments, shares, and saves.
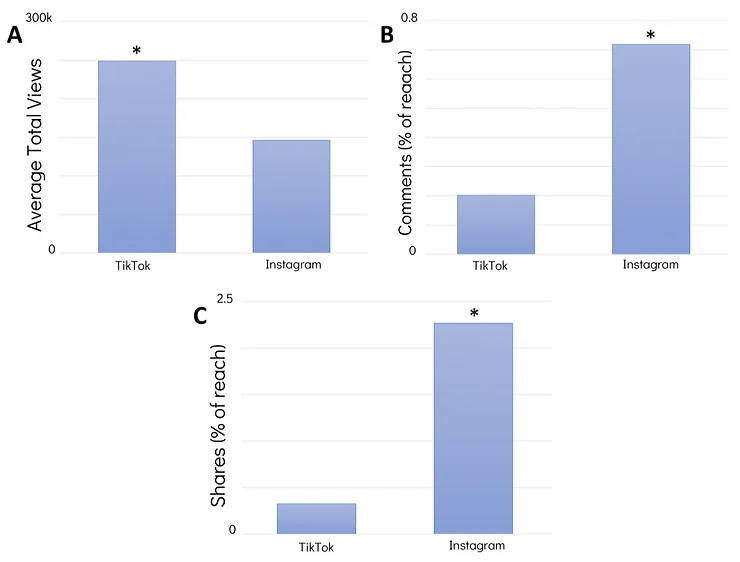
Finally, Habibi and Salim wanted to know which platform reaches the most people per post. By raw numbers, TikTok reaches considerably more people than Instagram, achieving more than 15 times more views per post. However, this metric may not be the most meaningful for any given content creator. For example, if a creator’s goal is to generate conversation, they may care more about the number of comments than the number of views on a post. If the creator’s goal is to spread new information, they may be more interested in the number of shares a post received. Figure 3 shows the authors’ results in comparing post performance by these metrics on TikTok and Instagram. Notably, Instagram performs considerably better by comments and shares, while TikTok performs better by number of views.
So, what kinds of content should you post on social media?
Well, that depends on the platform and on your goals! The authors present the following recommendations based on the results of this study:
- If you want to reach the largest audience possible, use TikTok.
On the other hand, if you want to generate sharing and conversation, use Instagram. - If you’re looking to reach the largest audience on TikTok specifically, use 40-60 second experimental-style videos.
- If you want your content to be viewed to completion on TikTok, the authors recommend using 15 second lecture-style videos.
- If you’re looking to foster general conversation around a topic, a 40-60 second lecture-style video is the best option.
- If you want to foster individual conversations stemming from a piece of content, your best bet will be 40-60 second experimental-style videos.
- Because dynamic content outperforms static content, the authors recommend using in-app video capabilities.
This study’s results do come with some limitations. For example, social media algorithms are generally black boxes and typically function uniquely. It is additionally hard to know whether a platform’s algorithm preferentially shows a shorter video over a longer video. Notably, TikTok’s algorithm primarily shows users content similar to what they have indicated interest in, while Instagram’s algorithm primarily shows content from accounts a user follows. Furthermore, the posts included in the analysis were posted to already-established accounts, and the Instagram account was older and had more followers.
This study represents one of the first to examine science content performance and engagement on TikTok in particular, and the resulting recommendations for effectively engaging users on both Instagram and TikTok can guide future science communication efforts to interrupt the mindless scrolling on these platforms!
Written by Stephanie Deppe
Edited by Jacqueline Goldstein
Cover image credit: Jeremy Bazenger (Unsplash)